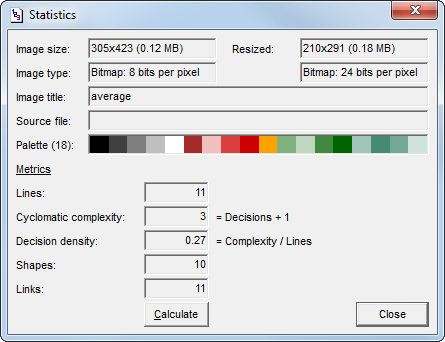
Visustin calculates a few flow chart metrics. You can find this feature via the Statistics command in the View menu.
The Lines count equals the number of physical source code lines the chart was created from. This line count includes all lines, be it code, comment or blank. A line ends at a newline character. Line continuation characters are not taken into account.
Cyclomatic complexity measures the number of decisions in a program. Cyclomatic complexity is counted from the flow chart structure as follows:
Cyclomatic complexity = Number of decisions + 1
What are decisions? Decisions are caused by conditional and looping statements, such as if, select, switch, do, repeat, while, for or catch. In the flow chart, a decision looks like a decision diamond or a loop shape. A shape that has more than one outward link is usually a decision. A shape is not a decision, though, if it represents an unconditional jump (call) that temporarily executes code elsewhere, then returns back to continue with the next shape.
Cyclomatic complexity equals 1 for code with no decisions. There is no theoretical maximum value since code can have any number of decisions.
Visustin displays the cyclomatic complexity for the code you have created the flow chart from. Depending on what the flow chart covers, you get the total complexity of an entire file (class, module, program). If the flow chart contains a single procedure only, you see the cyclomatic complexity of that procedure.
Procedure cyclomatic complexity (CC) = Complexity of a single procedure
Total cyclomatic complexity (TCC) = Complexity of a class, module or program
Both types of complexity are calculated the same way: count the decisions, then add one.
Cyclomatic complexity is also known as V(G), the graph theoretic number, or McCabe complexity.
A high cyclomatic complexity denotes a complex procedure that's hard to understand, test and maintain. There's a relationship between cyclomatic complexity and the "risk" in a procedure.
| CC | Type of procedure | Risk |
|---|---|---|
| 1–4 | A simple procedure | Low |
| 5–10 | A well structured and stable procedure | Low |
| 11–20 | A more complex procedure | Moderate |
| 21–50 | A complex procedure, alarming | High |
| >50 | An error-prone, extremely troublesome, untestable procedure | Very high |
The original, usual limit for a maximum acceptable value for cyclomatic complexity is 10. Other values, such as 15 or 20, have also been suggested. Regardless of the exact limit, if cyclomatic complexity exceeds 20, you should consider it alarming. Procedures with a high cyclomatic complexity should be simplified or split into several smaller procedures.
Cyclomatic complexity equals the minimum number of test cases you must execute to cover every possible execution path through your procedure. This is important information for testing. Carefully test procedures with the highest cyclomatic complexity values.
There is a frequently quoted table of "bad fix probability" values by cyclomatic complexity. This is the probability of an error accidentally inserted into a program while trying to fix a previous error.
| CC | Bad fix probability |
|---|---|
| 1–10 | 5% |
| 20–30 | 20% |
| >50 | 40% |
| approaching 100 | 60% |
As the complexity reaches high values, changes in the program are likely to produce new errors.
The use of multi-branch statements (such as switch, Select Case or Choose) often leads to high cyclomatic complexity values. This is a potential source of confusion. Should a long multiway selection be split into several procedures?
McCabe, the inventor of cyclomatic complexity, originally recommended exempting modules consisting of single multiway decision statements from the complexity limit.
Although a procedure consisting of a single multiway decision may require many tests, each test should be easy to construct and execute. Each decision branch can be understood and maintained in isolation, so the procedure is likely to be reliable and maintainable. Therefore, it is reasonable to exempt procedures consisting of a single multiway decision statement from a complexity limit. Note that if the branches of the decision statement contain complexity themselves, the rationale and thus the exemption does not automatically apply. However, if all the branches have very low complexity code in them, it may well apply.
Resolution: For each procedure, either limit cyclomatic complexity to 10 (or another sensible limit) or provide a written explanation of why the limit was exceeded.
Decision density (or cyclomatic density) measures the complexity relative to code size. Decision density is calculated by dividing cyclomatic complexity by lines of code:
Decision density = Cyclomatic complexity / lines of code
Cyclomatic complexity tends to be high in long pieces of code. Decision density is not affected the same way.
Visustin saves metrics in .gif, .png and .tif images. You can view the metrics by loading the file back in Visustin and selecting Statistics. More about save formats
For a more thorough metrics analyzer, try Project Metrics in Project Analyzer. It works with Visual Basic, VB.NET and VBA and produces a wide range of complexity metrics and other measurements. Note that Project Analyzer and Visustin may produce different metric values due differences in the calculation technique.