Enterprise Edition only
Visualize the structure of your system with Enterprise Diagrams. Reverse engineer your software back to design models. Understand legacy systems. Perform impact analyses. Detect bad design. Plan restructuring efforts. Start Enterprise Diagrams in the Enterprise menu of Project Analyzer.
File dependencies. This diagram shows file requires/is required by information. A→B means file A requires file B to compile or run. A red double-headed arrow indicates mutually dependent files, which should be avoided if possible.
File dependencies, circular groups boxed. This file dependency diagram emphasizes circular dependency groups. The groups are based on File dependency analysis. Consider removing the circular dependencies to reach better reusability.
File dependencies, circular groups collapsed. Save space by collapsing circular dependency groups. The groups are frequently very complex inside, making them hard to visualize. This option hides the circular dependencies in effort to make the diagram easier to read.
To see the hidden links inside the groups, get the circular groups boxed diagram for each group.
Inherits and Implements. This option builds a full class hierarchy diagram with interfaces. Not all projects use inheritance or interfaces. Therefore, the diagram may consist of separated classes only. For classic VB projects the diagram displays only Implements since there is no Inherits available.
Control flow. This diagram shows how procedure execution traverses between modules. It is the equivalent of a procedure call diagram taken to the module level.
Data flow. This diagram shows all data flows between modules. Data flows via variable read/write, procedure parameters and function return values. It is typical that data flows in both directions between 2 modules as the modules pass data via parameters and return values.
| Variable read | reader←variable |
| Variable write | writer→variable |
| Procedure call, "in" param | caller→destination |
| Procedure call, "out" param | caller←destination |
| Function return value | caller←destination |
Variable data flow. This diagram shows data flows between modules via variable read/write. The difference to the Data flow diagram is that procedure calls and return values are not taken into account. Thus, this diagram considers only direct variable based data transfer.
| Variable read | reader←variable |
| Variable write | writer→variable |

PicForm reads a variable from PicMain. The data flows from PicMain to PicForm.
Variable access. This diagram shows direct variable access between modules. The only difference to the Variable data flow diagram is the direction of the read access. This diagram is useful for reviewing access to global variables and data structures. Direct variable access is often considered bad. Instead of direct variable access, one should access data via properties or functions. This diagram reveals the direct variable access that could be rewritten.
| Variable read | reader→variable |
| Variable write | writer→variable |
Instantiate. This diagram shows where classes are being instantiated.
Data declarations. This diagram shows where classes, structures, interfaces and forms are being used as data types.
Form.Show order. This diagram type describes the order in which forms show other forms by calling Form.Show (or Form.ShowDialog in VB.NET). Form1 shows Form2 if it either calls Form2.Show, or the procedure call trees starting at Form1 contain a call to Form2.Show. Form1 may also show Form2 if Form1 contains a UserControl that shows Form2. This graph does not include self-showing forms. A self-showing form is one that displays itself in its constructor or event such as Form_Load. Showing forms by setting their Visible property to True is not included in this graph.
Procedure calls. The procedure call diagrams display all calls between the selected procedures.
(click the image for a larger view)
Procedure calls, grouped by module. View calls between modules and inside them.
(click the image for a larger view)
Procedure calls, cross-module only. Only calls between modules are displayed. Intra-module calls are hidden. Document cross-module calls and calls to public interfaces, leave out internal details.
(click the image for a larger view)
Project dependencies. This diagram shows dependencies between several projects. It is useful with a multi-project analysis.
File belongs to project. This option lets you view which files belong to which project in a multi-project analysis. Remember to select the project file(s) into the diagram, otherwise there are no links.
Cohesion. The Cohesion diagram displays the procedures of a module and also the variables they use in that same module. The diagram lets you understanding the procedure-to-procedure and procedure-to-variable relationships within a single module.
The Cohesion diagram uses the same analysis as the LCOM4 cohesion metric. The module is split into related groups based on procedure calls and variables shared. The more groups, the less cohesion. The LCOM4 value [1], [2] etc. is displayed next to each module. Even though LCOM4 is a class metric and less useful for standard modules, forms or Structures, Cohesion diagrams are available for all module types.
Recursion. The Recursion diagram helps find indirect recursion. Indirect recursion means procedure A calls another procedure which ultimately calls A again.
While recursion is a perfectly valid program design, unintentional or ill-defined recursion can lead to an infinite loop, stack overflow or slow performance. Recursion looks like a red two-way arrow or a call circle. The number of recursive procedures is displayed as [2], [3] etc.
Recursion diagrams do not consider direct recursion where a procedure calls itself directly.
|
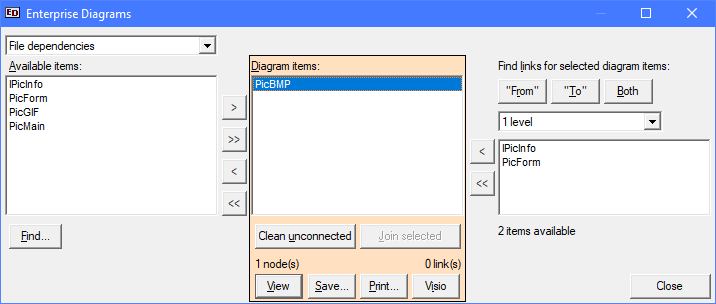
Available items. This list contains everything that is not (yet) included in the diagram. Press either or to add items to the diagram. You can also press Insert or Ctrl+Insert, respectively. You can drag & drop selected items between the lists. Several keyboard shortcuts are available as well. Press to locate available items. |
Diagram items. This list contains what will appear in the diagram. All links between these items will be included automatically. Press or Delete to remove selected items from the diagram. To clear the entire list, press or Ctrl+Delete. Press Shift+Delete to remove everything but the currently selected item(s). Cross-project links only appears when analyzing multiple projects. Select it to display links between projects and to leave out internal details. |
Find links. To add more linked items to the diagram, select one or more items in the Diagram items list and press , or . This will search for new items that are not listed yet, but that are linked to the selected item(s). In the example, the user has searched for 1 level of links starting with PicBMP. Press either or to add the linked items to the diagram. Via Find links you add levels to a call diagram, for example. |
The two large buttons help you adjust the diagram items.
| Remove unlinked items from the Diagram items list. This reduces diagram pollution. | |
| Join selected items (2 or more). Simplify the diagram by joining linked items into one. |
Once you're done with the selections, press one of the buttons at the bottom:
| Create and view a diagram. | |
| Create diagram and save to a file. | |
| Create diagram and display Print Preview. | |
| Create diagram in Microsoft Visio. |
Requires Microsoft Visio (any edition) installed on the same computer. Compatibility tested with Visio 2003, 2007, 2010, 2013, 2016 and 2019.
You can use Enterprise Diagrams to produce Visio diagrams. The selected diagram structure will be sent to Visio, which will give it a layout. You can edit the diagram in Visio, add comments, rearrange and delete parts of it.
The Visio diagrams are built using the EntDiag1.vst template file. The file must be in your Project Analyzer directory. You can edit the file to tune the diagrams to your own tastes. As an example, you can change the shapes or their colors. Keep the shape names unchanged as they are used by Enterprise Diagrams.
Tip: The various layout options in Visio may prove useful. Experiment to find the best layout for your project.
You can save the diagrams in several file formats.
Don't expect miracles! No diagramming solution can visualize a large complex system on a single sheet. The best diagrams are ones with less than 100 nodes. That means less than 100 files, modules or procedures, depending on which diagram type you want. There is no way we can fit all your 2000 procedures in a diagram while keeping it readable.
The more nodes and links there are, the less readable the diagram usually gets. Rather than charting the entire system, it is often a better idea to make several smaller charts.
File dependency diagram of a 70,000-line program (138 nodes, 470 links)
The monster diagram above is technically correct, yet totally unreadable. The program is complex but relatively well-structured. It is not overly large, only 70,000 lines. No matter what layout you use and how deep you zoom, you cannot read such a big graph. Instead of the big diagram, one would need to make several sub-diagrams, possibly by utilizing the Subsystem report.
Project Graph produces diagrams using a different approach. It is suitable for tree-format diagramming: links from the current node forward or backward. Enterprise Diagrams takes all links into account: all links to all directions from all nodes in the diagram. This makes the Enterprise Diagrams more complex but also more informative, covering all the information available.
| Project Graph | Enterprise Diagrams | |
|---|---|---|
| Type | Interactive tree | Complex network |
| Output | Image, print-out | Image, print-out, Visio diagram |
| Graph types available | ||
| File dependencies | Yes | Yes: All, circular groups boxed or collapsed |
| Procedure calls | Yes | Yes: All, grouped by module, cross-module only |
| Inherits and Implements | Yes | Yes |
| Control flow | Yes | Yes |
| Data flow | Yes | Yes: All data flows, variable data flow |
| Variable access | no | Yes |
| Instantiate | Yes | Yes |
| Data declarations | Yes (instantiation colored) | Yes |
| Form.Show order | Yes | Yes |
| Project dependencies | Yes (limited capability) | Yes |
| File belongs to project | no | Yes |
| Cohesion | no | Yes |
| Recursion | no | Yes |
If you experience an error every time you try to create a diagram, run Config.exe in your Project Analyzer directory.