Pro and Enterprise Edition only
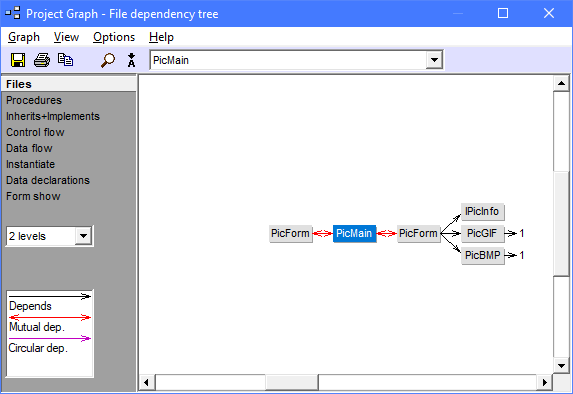
Project Graph builds tree-style graphs out of Visual Basic code. (See also Enterprise Diagrams, which produces graphs with a different approach.)
The available graph types are:
Read Terminology for more information on the data in the graphs.
Double-click a node to move in the tree. Right-click a node to display a context-sensitive menu.
Levels. The initial maximum number of levels generated in the graph is controlled by the levels combobox on the left. This setting is there to restrict the graph size on complex projects. The absolute number of levels is not limited. You can expand more levels as described below. Keyboard shortcut: You can change the Levels setting by pressing Shift+1 for 1 level, Shift+2 for 2 levels etc.
Expand. Because trees easily grow very large, the initial depth of a tree is limited. However, you can manually expand branches by right-clicking a node where the tree can be further expanded (indicated with an arrow like this: → 3) and selecting Expand. You can also move to a node and press the x key to call expand. Sometimes expanding will produce a spaghetti-like call tree. To avoid this, expand nodes in up-to-down order.
Collapse. You can collapse a branch in a large graph by right-clicking it and selecting Collapse branch. You can also press the c key for this effect. If you need to view the branch again, you can expand it back.
Hide. You can hide a single node from the graph by right-clicking it and selecting Hide node (or just press the h key). If you hide a node in the middle of the graph, the nodes to the left and right of it are connected with gray arrows. This indicates that the relationship between those nodes is indirect, because you just hid the direct connection. Hiding is different from collapsing in that it affects just one node. The node is completely removed from the graph but its descendants are not. Extensive hiding can make your graph into a spaghetti, so use it sparingly.
You can print the graph at any time as it appears on the screen. Project Graph will fit the graph on one paper, reducing the size when necessary. Graphs are often best printed in landscape mode.
When a monochrome printer is used, Project Graph reduces the colors of the graph. This way the information stays easier to read even though the color-coded information is lost. You can save the color information by copy & pasting the graph to your favorite word processor or image handling program and printing from there.
You can save the currently visible graph in a picture file. Select Save as in the Graph menu. The supported picture formats are WMF Windows metafile, EMF enhanced metafile, BMP bitmap and GIF file.
A normal arrow has one arrowhead. Two arrowheads indicate a two-way or mutual relationship. Depending on the graph type, this may indicate a problem, or not.
Violet arrows → indicate a circular file dependency, or a circular procedure call. It is possible to traverse from a file/procedure to itself via a series of circular arrows. A circular file dependency is usual, but it is avoidable for achieving better reuse. A circular procedure call is a case of recursive programming (see two-way calls above).
Gray arrows → indicate an indirect relationship. This happens when nodes are hidden along the arrow. Nodes can be hidden by options, or by manually hiding them. When you see a gray arrow, there's always a hidden node along it, maybe even more than one. If you need to see the hidden node(s), create a new graph.
Inherits and Implements tree uses different arrow colors to indicate the type of inheritance. A red arrow → indicates an Implements relationship, and a blue arrow → indicates an Inherits relationship. The classes to the left are the ancestors. To the right are the descendant classes.
Data declaration tree shows regular data declarations in black, 2-way data declarations with a red 2-headed arrow ↔ and instantiate relationships with a blue arrow →.
A regular node is light gray. The graph center node is light blue. This is the node around which the entire chart is created.
On larger graphs you can see dark gray nodes too. These nodes exist several times in your graph. Nodes that exist several times are often suppressed to make the graph smaller. In this case, you will notice "<See*" on the suppressed node. This indicates that you should look for the same node to the left. The node will be in dark gray to make it easier to find. The dark node just a normal node in all other respects.
In inheritance graphs, a dark node represents an ancestor class that's not defined in your source code. You can often find this for .NET forms that inherit from System.Windows.Forms.Form.
Due to the nature of graphs, they may easily get unbelievably large. When this happens, you have several options to cope with it.
This option reduces text and font size to keep the graph smaller.
Hide private procedures. With this option you only get to see procedures whose scope is Protected, Friend, Protected Friend or Public. This option is useful if you want to get a big picture of how your (non-private) procedures are working together without going into the details.
Hide property procedures. With this option you won't see any properties in your graph. This option is useful if you consider procedures as a form of data storage and not really as a part of your program logic or control flow.
Hide binaries. With this option you can focus on your own source code. All binaries, such as DLLs, API calls and COM classes will be hidden.
A hidden procedure may call other procedures. If these procedures don't fit in your hiding criteria, they will be shown on the graph. In this case, you will see a light gray arrow. This color means that one or more hidden procedures exist along the call. Should you wish to see which procedures they are, you will have to uncheck the hiding in the Options menu.
Backward links only. This options shows only the links to the left. Use it when you are interested in "used‑by" relationships—when doing change impact analyses, for example.
Both directions. This is the default. You get to see both forward and backward links.
Forward links only. This options shows only the links to the right. Use it when you are interested in "uses" relationships—when documenting what your code does without the need to know who uses it.
Project Graph uses the font setting in Font Options, in the Options menu of the main screen. If this font is not a TrueType font, you may notice that the Print, Save As and Copy commands use a different font. This is a font that Windows substituted. Select a TrueType font to get rid of this problem.
Enterprise Diagrams produces graphs using a different approach. Project Graph is suitable for tree-format diagramming: links from the current node forward or backward. Enterprise Diagrams takes all links into account: all links to all directions from all nodes in the diagram. This makes the Enterprise Diagrams more complex but also more informative, covering all the information available.
Project Graph doesn't do statement-level flow charts of each If..Then, Else, Select Case, For..Next, Do..Loop etc. For this purpose try Visustin.