Why flow charts?
Visustin, flow chart generator
The most accurate documentation of any software application is its source code. Understanding source code is notoriously difficult, however. Interpreting source code requires in-depth knowledge of programming. Reading raw code is prone to errors even when done by expert developers.
This is where flow charts come to help. Flow charts display code in a natural diagram format. They convey all the information in the source code in a human-friendly visual way. Flow charts are a super-fast method to see the logic in a piece of code. They are an extremely powerful tool for understanding what a program really does.
Logic is what flow charts are all about. A program performs its logic with decisions, that is conditional statements such as "if" and "else". In a flow chart these decision points are instantly visible. Each decision diamond clearly displays the conditions of the decision. It's easy to follow the alternative paths running from each decision forward. Understanding the decisions plays a key role in understanding what a program does.
Loops and jumps are what make many programs complex and hard to understand. Flow charts offer a great solution. Following loops and jumps is as easy as following arrows through the chart. Even the notorious "goto" jumps, which often make programs unstructured and error-prone, are now just simple arrows to follow.
Who needs flow charts?
Flow charts are a tool for programmers and non-programmers alike. In order to read source code, it is no longer necessary to be an expert in a particular language or technique. Flow charts are ideal for reading code written in an unfamiliar programming language or with an extinct programming system. Managers appreciate understanding what their programmers have written, even if they are not proficient enough to write the code by themselves. In fact, flow charts are so easy that even non-programmers and novices can understand program logic.
Not limited to just novices, flow charts are also loved by highly experienced developers. Gurus appreciate the new view that flow charts give into raw code. With this new view it is possible to catch bugs that are invisible otherwise, avoid writing bad fixes to existing code, and read someone else's code more quickly and accurately.
Generating flow charts with Visustin
Until recent years, flow charts were drawn by hand. Today we get flow charts generated programmatically.
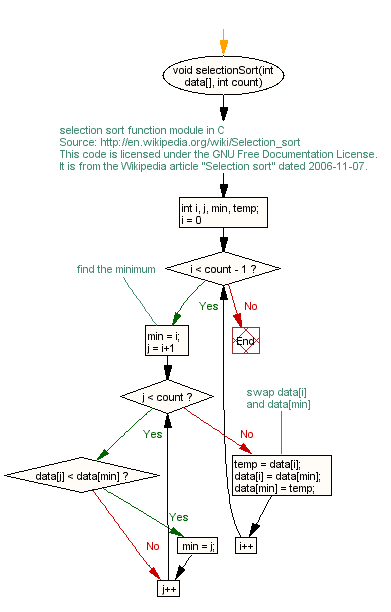
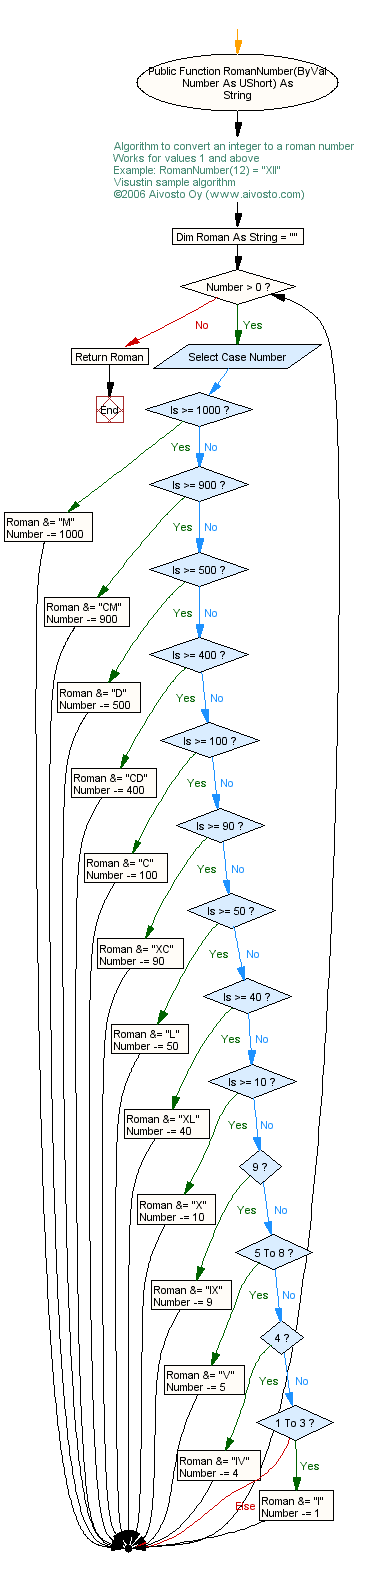
Visustin is a flow chart generator that draws a visually pleasing diagram from any piece of source code, be it simple or complex. Just press a button and a diagram appears. Reading source code has never been easier. Rather than spending hours drawing diagrams, you can immediately start reading the code in flow chart form.
Automated flowcharting with Visustin is an ideal solution. It's not just about saving days of work. It also ensures that software documentation is accurate and up-to-date. Out-of-date diagrams are no problem. You just press a button and get a refreshed chart.
Visustin works both interactively and in bulk mode. When using it interactively, you just load your code and immediately view it as a flow chart. In bulk mode you process your source files in a batch. This is a great way to document a program and also to update previous documents when the code has been changed. Visustin saves flow charts in zoomable PDF files and several standard image formats. Users who prefer editing flow charts with MS Visio can have their flow charts exported in Visio file format. Saving as a web page is supported. An option exists to create UML Activity Diagrams for users who prefer UML style to conventional flow chart style.
Visustin is a true multi-language tool. Supporting most common programming languages, Visustin can be used in multi-language environments and also reused in the next project, even if it's in a different language or on a different platform.
Tasks to perform with flow charts
Flow charts are a helpful tool in software development, maintenance and evolution. They can be used in both new development and re-engineering projects. Below you find different tasks where flow charts help you.
Document generation and update
Recover missing documentation. Generate flow charts directly from source code when other documentation is not available. Preserve flow charts as the most accurate and detailed form of documentation available.
Re-document existing code. Update outdated documents. Use existing code as the source of new documentation when previous documents are inaccurate or outdated.
Extract facts. Refine information from existing source code. Obtain business rules with the help of flow charts.
Recover architecture and design. Recognize design patterns and coding patterns by reverse-engineering existing code. Understand decisions made by programmers who are no longer available for the project.
Software maintenance and evolution
Run code review. Observe flow charts to detect incorrect logic and other anomalies. Verify algorithms. Improve existing code and fix hidden errors.
Perform change management. Run change impact analysis before writing changes. Control the ripple effect caused by changes. Reduce bad fix probability by understanding the impact of changes before changes are made.
Manage restructuring, refactoring and renovation projects. Recognize convoluted program parts that require restructuring. Control success of restructuring by comparing old and new logic with the help of flow charts.
Manage conversion projects and software modernization. Convert and migrate existing code to a new platform or language. Verify accuracy of conversion with flow charts.
Reuse old code. Use flow charts to detect and extract reusable routines. Reuse existing software assets by using flow charts to understand their internal functionality.
Why flow charts and not other diagrams?
Flow charts are intuitively understood by both professional developers and other people. They are a common diagramming "language" that everyone can read. Not limited to software only, flow charts are also used in process management and other fields of engineering.
Flow charts are so detailed that there is no need to create any more detailed diagrams. They effectively display everything that a program does. Other diagram types generally convey much less information. Most UML charts, for example, don't display individual decisions, loops, statements or variables.
Flow charts are a "whitebox" approach to diagramming. Every detail is visible. Other diagrams, such as class diagrams, generally show just programming interfaces or class relationships. They don't show the much of the implementation behind the interfaces. These types of diagrams are "blackbox" diagramming. Details are simply left out.
UML Activity Diagrams are an alternative to flow charts. They convey the same information as flow charts, but require more symbols and more space. Compared to UML Activity Diagrams, flow charts are both more compact and more intuitive, especially what comes to detailed software documentation. Visustin supports both flow charts and UML Activity Diagrams to match everyone's preferences.