Help contents
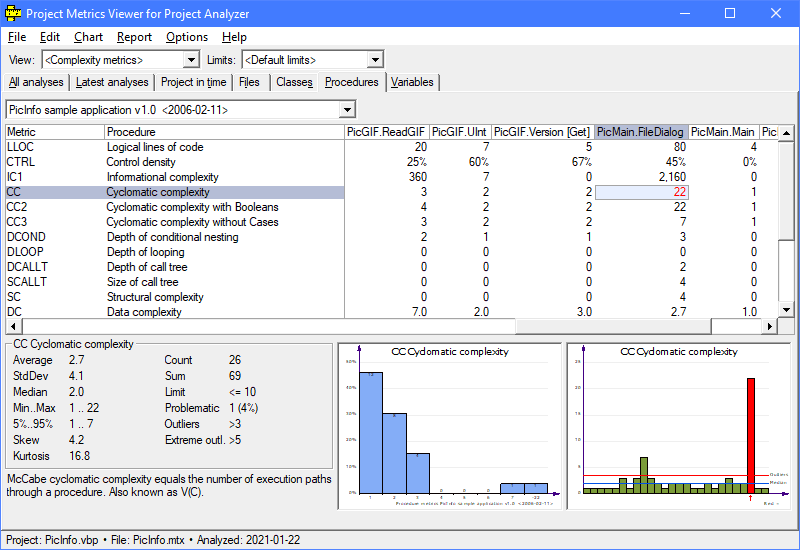
Project Metrics Viewer main window
Project Metrics
Project Metrics Viewer displays data previously stored in .mtx files.

Metrics tabs
The tabs in the main screen of Project Metrics represent different levels of metrics.
All analyses tab. This tab shows project-level metrics for all analyses found. Project-level metrics provide summary-level data for projects, project groups or solutions, depending on what you have analyzed. By project-level metrics we mean metrics that cover the entire analysis, whether a single project or a multi-solution system.
Latest analyses tab. This tab shows project-level data for the latest version of each project. You can compare the latest status of your systems, perhaps making cross-team evaluation of the work done lately.
Project in time tab. This tab presents historical and current data. It shows how the selected project has developed in time. This tab is good to monitor changes in a project, project group or solution, such as changes in time or between different versions. You can also monitor changes in a single file, class or procedure.
The Project in time tab requires that Project Metrics can group your project versions together. If different versions of your project do not appear at the same time or if they appear in a strange order, you may have to fine-tune the project names and dates.
See Databases on how to edit this information.
Project in time combo boxes

Combo "Change (+/-)"
A combobox on the right displays additional choices, listed below. The change metrics appear when you have saved metrics for more than one version of a single project.
Metric value. Absolute metric values by project version. This option is the default.
Change (+/-). Absolute metric change between versions. This option is good to monitor the rate of change and also to see the direction of the change (plus is up and minus is down).
Change = new − old
Change (%). Relative change between versions, displayed as a percentage. This option is good to see how a project matures. A mature project should have low change percentages.
Change% = (new − old) / old * 100%
Change/day. Metric change divided by the number of days passed (all days, not workdays). This option allows to monitor things like productivity of coding (LLOC/day) or documentation (MCOMM/day).
Change/day = (new − old) / days
Change/month. Metric change divided by the number of months passed (30 days per month). This option is appropriate if the number of days passed between versions is large.
Change/month = (new − old) / days * 30
Combos "File:" and "PicInfo.cls"
These comboboxes let you select the level of detail to look at. When you select "Entire analysis", you see historical development of analysis-level values. With the "File:" option you can see historical development of a single file. Similarly, you can select "Class:" or "Proc:" to see historical development of a single class or procedure.
Files tab. This tab shows metrics for each physical source code file in the selected analysis.
Classes tab. This tab shows object-oriented metrics for each class in the selected analysis. It is empty in non-OO projects. Class metrics are only available for class modules, not for standard modules or any other non-class modules.
Procedures tab. This tab shows detailed metrics for each procedure in the selected analysis.
Variables tab. This tab shows metrics for each variable in the selected analysis. Variable metrics are available for global and module-level variables, but not for local variables or parameters. Old analyses stored with Project Analyzer v7.1 do not display variable metrics.
File menu
Databases
Select databases to view. Read more
Export table
Export the current contents of the metrics grid.
Before exporting, make sure that the data on the screen contains the values you want to export. Check the View combobox before exporting. If you want to export more than one page of data, click the tabs to switch pages and export to several files.
Export supports the following file formats:
- CSV (Comma Separated Values). This format is useful for importing into a spreadsheet or database program such as Microsoft Excel or Access.
- HTML file. This format is useful for printing, keeping as documentation or publishing online.
- Tab Delimited Text. This is a plaintext format with tabs between the columns.
Export XML
Export the currently open project in a .xml file. This is intended for importing metrics data into XML based applications. The data exported covers all the data in the selected project (.mtx file) regardless of the currently selected options.
Alternative. You can also right-click a .mtx file in Windows Explorer to save it in .xml format.
This requires setting up file associations for .mtx files via the File associations dialog in Project Analyzer.
Edit menu
Copy table
Copy the currently visible grid contents to the Clipboard. You can paste the figures to your spreadsheet program for further analysis.
Find line
The Find line command in the Edit menu searches for a match in the first column of the grid.
Wildcards (?*) are allowed in the expression (use VB6's Like syntax).
Chart menu
Metric charts
Reports menu
Metric reports
Options menu
Selections
Project Metrics supports a wide range of metrics, possibly more than what you need at one time. Use the View combo box in the main screen to select a smaller number of metrics to view. Limiting the number of metrics lets the program run faster and helps you focus on what's essential for your purposes.
You can define your own selections with the Selections command in the Options menu or use the following predefined selections:
- <All>
- All metrics are in use.
- <Complexity metrics>
- Complexity related metrics.
- <Constant metrics>
- Metrics for constants and Enums.
- <Documentation metrics>
- Commentation related metrics.
- <Line counts>
- Physical and logical line counts and percentages.
- <Object Oriented>
- Metrics related to classes.
- <Project Analyzer Classic>
- Metrics provided by Project Analyzer v6 and earlier.
- <Simple metrics>
- Simple but elegant metrics.
- <Starter metrics>
- Default metrics for a start.
- <Statement counts>
- Number of statements: all statements, declarative ones, executable ones, ...
- <Variable metrics>
- Metrics for variables & parameters.
Limits
You can highlight metrics below or above acceptable limits via the Limits functionality. More about limits
Display charts
Toggle automatic chart display on/off. You can still get charts in the View menu when Display charts is off.
Rotated view
Toggle rotated view on/off. In rotated view, grid columns become rows and rows become columns.
Project Metrics
©Aivosto Oy Project Analyzer Help

