Editor requires Visustin Pro Edition.
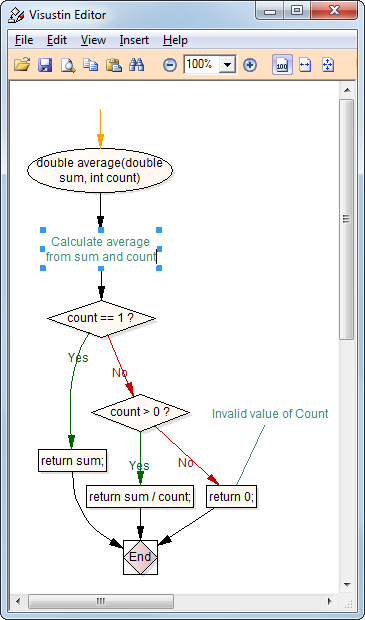
Draw and edit flow charts. Create flow charts automatically, then edit them. Add shapes, draw links, edit text, layout shapes, draw charts from scratch. Visustin Editor features full editing of flow charts and UML Activity Diagrams.
Tip: It is not necessary to press the button before .
To save your flow chart, choose Save in the File menu or press  .
.
Save for editing later. To save the flow chart for opening it again in Editor, save it in Visustin Editor chart format (.flw). It is the Editor's native format. You can load it back to Editor to continue working on the chart.
Save as PDF. To give the flow chart to your colleague, save it as PDF. Note that you cannot load a PDF back to Editor.
Save as an image. To include the flow chart in your documentation, save it in a standard image format such as BMP and GIF. Note that you cannot load such files back to Editor.
Save as an optimized image (low-color mode). The Save optimized as command in the File menu produces smaller low-color bitmap images. Especially designed for large charts in the Full color mode, optimization limits the number of colors to 16. This saves memory and disk space. The drawback is that color slides are lost, as well as any colors beyond those 16. Note: The optimization ratio varies by file format. Optimization only affects bitmaps. It has no effect on vector format files such as FLW, PDF, EMF or WMF. Optimization makes no difference on monochrome charts or charts with 2..16 colors.
Saving tip. Saving as a bitmap image may give a considerably large file, or even fail, in the Full color color mode. This is especially true for BMP files. Save as PDF instead. You can also use the Save optimized as command. Consider switching to another color mode to avoid the problem.
See also: Save file formats
To print, choose Print preview in the File menu or press  . This will print the entire flow chart area. To print a smaller area, first select the shapes you wish to print. Then choose Print preview (selected only) in the File menu.
To make more shapes fit onto a sheet, use the Scale and Paginate commands in the Edit menu. The Scale command decreases the entire chart into a smaller area. The Paginate command moves selected shapes off page boundaries.
Tip: Select the correct page size via Page setup before running Editor. When drawing a flow chart Visustin considers page breaks in the layout.
| Menu command | Shortcut | Action |
|---|---|---|
| Edit|Undo | Ctrl+Z | Undo previous action(s). |
| Edit|Redo | Ctrl+Y | Reverse previous Undo(s). |
| Edit|Select all | Ctrl+A | Select all shapes and links. |
| Edit|Select connected | Alt+Mouse click | Select all connected shapes and links, such as one function in a big chart. |
| Edit|Reverse selection | Select the unselected, unselect the selected. | |
| Edit|Straight links | S | Make selected links from curved to straight lines. |
| Edit|Round links | R | Make selected links from cornered to rounded. No effect on straight links. |
| Edit|Paginate | G | Move selected shapes off from page borders. Useful before printing. |
| Edit|Scale | Decrease the chart to fit more shapes on a printed page. Scale affects Save and Print. | |
| Edit|Find | Ctrl+F | Search for text. |
| Edit|Find again | F3 | Search for the same text again. |
| Insert|Shape | Right-click an empty area | Add a new shape to the chart. The actual shape and color depends on the current settings in the Options menu of the main window. To connect a new shape to an existing shape, select the existing shape first, then insert. To add a shape in the middle of a link, select the link first, then insert. |
| Right-click a shape or a link to bring up a popup menu. You can also press the Application key or Shift+F10 on the keyboard. | ||
| Popup menu | Shortcut | Action |
| Edit text | F2; Mouse double-click | Edit the text of a shape or a link. |
| Color | C | Change the color of the selected shapes and/or links. |
| Font | F | Change the font of the selected shapes and/or links. As an alternative shortcut, press Ctrl+< to decrease the font and Ctrl+> to increase it. |
| Properties | Alt+Enter | Advanced. Edit all available properties of a shape or a link. |
| Insert | Add a new shape connected to the currently selected shape, or in the middle of a link. The actual shape and color depends on the current settings in the Options menu of the main window. | |
©Aivosto Oy · Visustin Help