What is it? Visustin is a flow chart generator for software developers. Save documentation efforts with automatic code visualization. Visustin reverse engineers your source code into flow charts or UML Activity Diagrams. Visustin reads the if and else statements, loops and jumps and builds a diagram — fully automated. No manual drawing is required.
Why flow charts? Flow charts help you understand complex systems. Fix bugs and write improvements faster than before. Review and debug algorithms. Verify program logic. Document complicated functions. Restructure incomprehensible code. Don't struggle reading hopeless spaghetti code. Read flow charts to gain a quick insight. With flow charts you save time, find lurking bugs and stay away from adding new bugs to badly understood code.
Does it work for me? Visustin runs on Windows. Your source code can be for Windows, Unix, MacIntosh, MS-DOS, mainframe, any processor or environment, as long as it's in one of the supported languages. Visustin works independently of your programming environment, libraries or hardware. All you need is your source code.
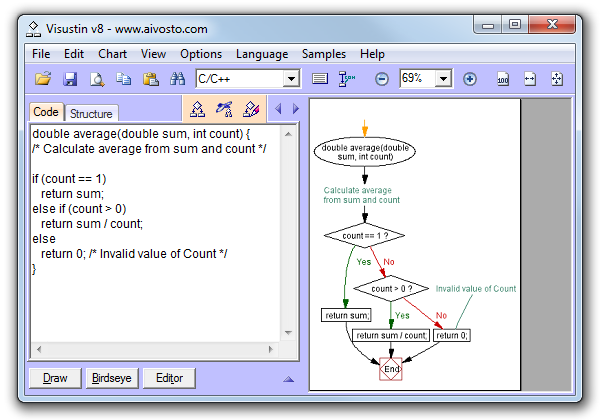
How does Visustin work? Open up your code in Visustin to flowchart it automatically. View, edit, save and print charts. Or export to Visio. Or process files in a batch with bulk flowcharting.
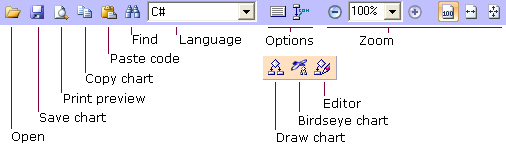
Step 1. Select your programming language using the dropdown list in the toolbar. Visustin supports tens of languages. If you don't find your language, try different languages to find an alternative that is closest to yours.
Step 2. Load your source code. You have several alternatives:
 button on the toolbar. Visustin loads any plain text file.
Note: Some programming systems save code in binary files. Visustin can't load binary files. In this case, Copy & Paste the code to Visustin.
Step 3. Draw the flow chart. Press the button or hit F5. Visustin automatically creates a flow chart from your code. No editing is necessary.
Alternative: Press the button or hit F6. A smaller "bird’s eye" chart appears. This mode gives a quick overview while not displaying so many details.
To scroll the flow chart, keep the Shift button down and move the mouse pointer over the chart. To zoom, use the - and + buttons on the toolbar, or hold down Ctrl while scrolling the mouse wheel, or hold down Ctrl while clicking the left or right mouse button.
By default, Visustin generates diagrams in the conventional Flow chart style. This style is easily understood by programmers and non-programmers alike. In the Options menu you can also find another style: Flow chart alternative style. This style uses slightly different symbols at places. In general, these two styles are very similar.
In order to produce UML-like diagrams, select UML activity diagram style in the Options menu. This style is an adaptation of UML2 Activity Diagrams. Note that Visustin doesn't produce any other UML diagram types, such as class diagrams.
All styles contain the same information, but in a different format. The difference is in the chart symbols. Pick the style you prefer.
| Sample code | Flow chart | UML |
|---|---|---|
If x < 10 Then y = 1 End If |
 |
 |
You have several options to using the flow charts or activity diagrams in your documentation:
Note: These actions are disabled in the free demo version. Check out our sample charts to see what you can expect. For a test drive, feel free to send some of your code to Aivosto. We will save or export the charts for you.
Visustin creates flow charts in a fully automated way. With Visustin Editor you can adjust them as needed or even draw new charts from scratch. Press the button or hit F7 to create a flow chart in the Editor. The Editor requires Visustin Pro Edition. It is enabled in the free demo version as well, but saving and printing are disabled.
Use the Structure tab to flowchart a part of a larger file. Check the functions or modules you wish to flowchart and press the button.
Flowchart selected lines. Select the code lines you wish to flowchart and press the button.
Draw the Clipboard. Copy your source code to the Clipboard. Hit Ctrl+D to Draw it.
Drag & Drop code into Visustin. Drag either a source code file (from Windows Explorer) or a selected code snippet (from your code editor). When you drop the code, Visustin loads the code and takes action based on where you dropped it:
Code samples can be found in the Samples menu.
It's not necessary to press before printing, saving or editing. Simply press the appropriate button.
Capabilities
Command line syntax
Keyboard and mouse shortcuts
Options
©Aivosto Oy · Visustin Help